What a fully functioning data commons and coordinated approach to data sensing, integration, use, can add to steward- ship of NZ eco-systems
Use
Prediction
What is going to happen next? Mast year? Forecast diversity? Forecast incursion rate?
Scale science
Pooled data to get ecosystem view, re-use of high cost data, track gene drive impact on other species (economy of scope)
Investment decisions
Learn what works at scale, early. Measurability provides opportunities: Profit/risk share reduced forward pest risk with government. E.g. Forward investment approach. Bio-bonds
Motivate/mobilize/enable/incentivize
Because results can be tracked could have rewards, prizes, rankings, ...have to be careful about perverse incentives! E.g. Dob-a-rabbit photo scanning for schools and volunteers. X-prize for science/technology development. Community rankings for land parcels and quality of sensing data
National investment and learning
National coordination/ collaboration across shared view and orienting KPIs
Mapping; predicted mast season, predictor burden, biodiversity indicator, which seasons doing well (by intervention), community engagement level, incursion directions, gene drive spread. Instead of one-off papers, put it on a shared self service dashboard = easy access, shared view, drive innovation and self awareness
Local coordination
“Our land parcel” analytics: Localised community planning and monitoring, operations and data capture. Where have we been, what’s happening on our boarders, which traps need servicing, who has been where (micro-GIS lines of our troops)?
Includes standard dashboards of in-common metrics; Estimated possums; 4,600
Rats 120,000 (down 12%)
Predicted mast year; high risk 2017
Soil bio-diversity quality; No data
Water bio-diversity quality; 23 organisms per gram National rank: 3rd
Similar ecosystems; 1st
Bell-bird 200 (up 40%)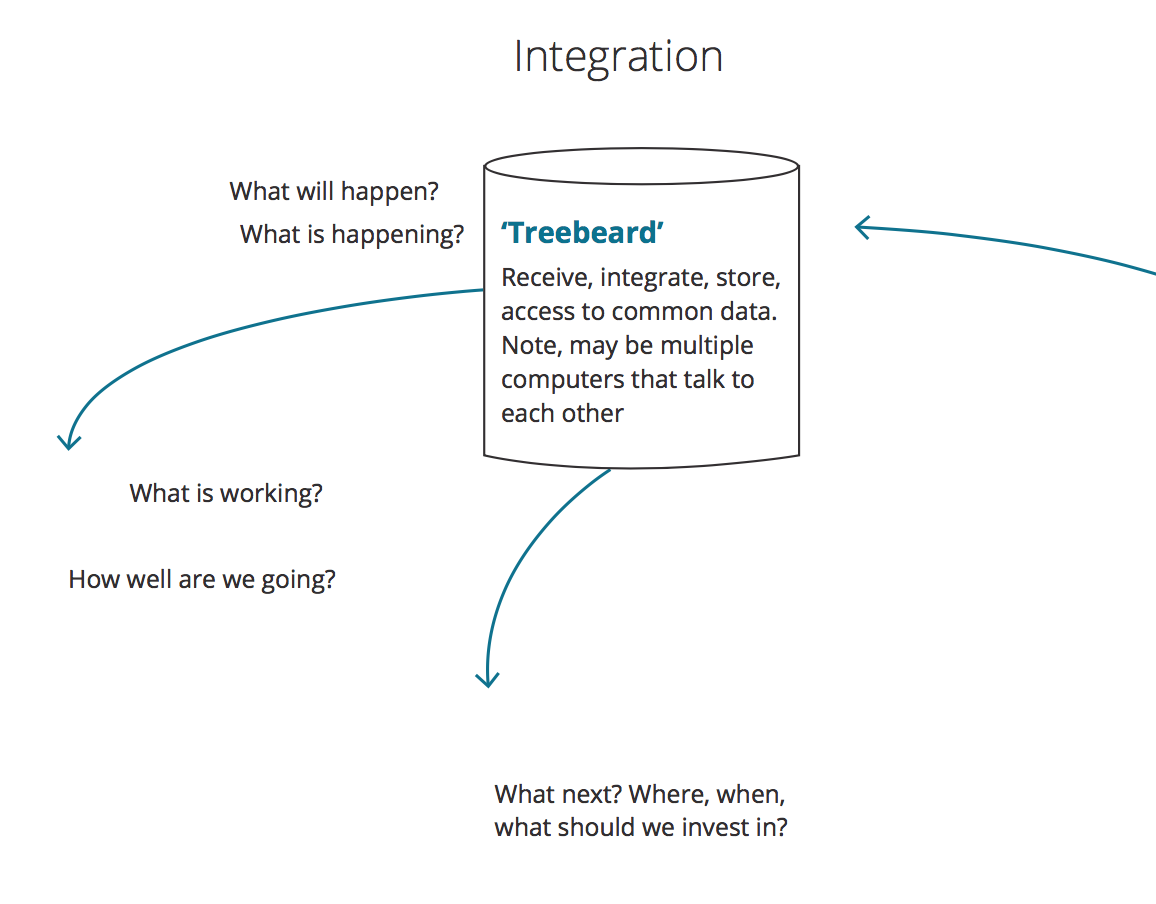
Interoperability
Solving the 7 challenges to having a coordinated data community.
- Design
- Commons
- Engagement and control
- Transaction providence
- Transaction interoperability
- Integration
- Technology
Feedback
Strategically: New initiatives, collection, investment. E.g. Do more of X here
Tactically: near real time operational feedback - e.g. photosnapped a ferret, batteries flat, trap needs clearing
Sensing
Two things happening here.
- Sensors are cheaper, smaller, remote, real time, connected, wireless, self charging, smarter (analytics at source) and can measure new things (e.g. Genome content (bio- diversity) of stream).
- Organization and uploading the data itself is also easier; Use of QR codes, what words, wireless networking and upload and GIS and photo capability of phones using standardized apps provides lower cost, more standardized data capture by (sometimes) less expert collectors, or automated collection.
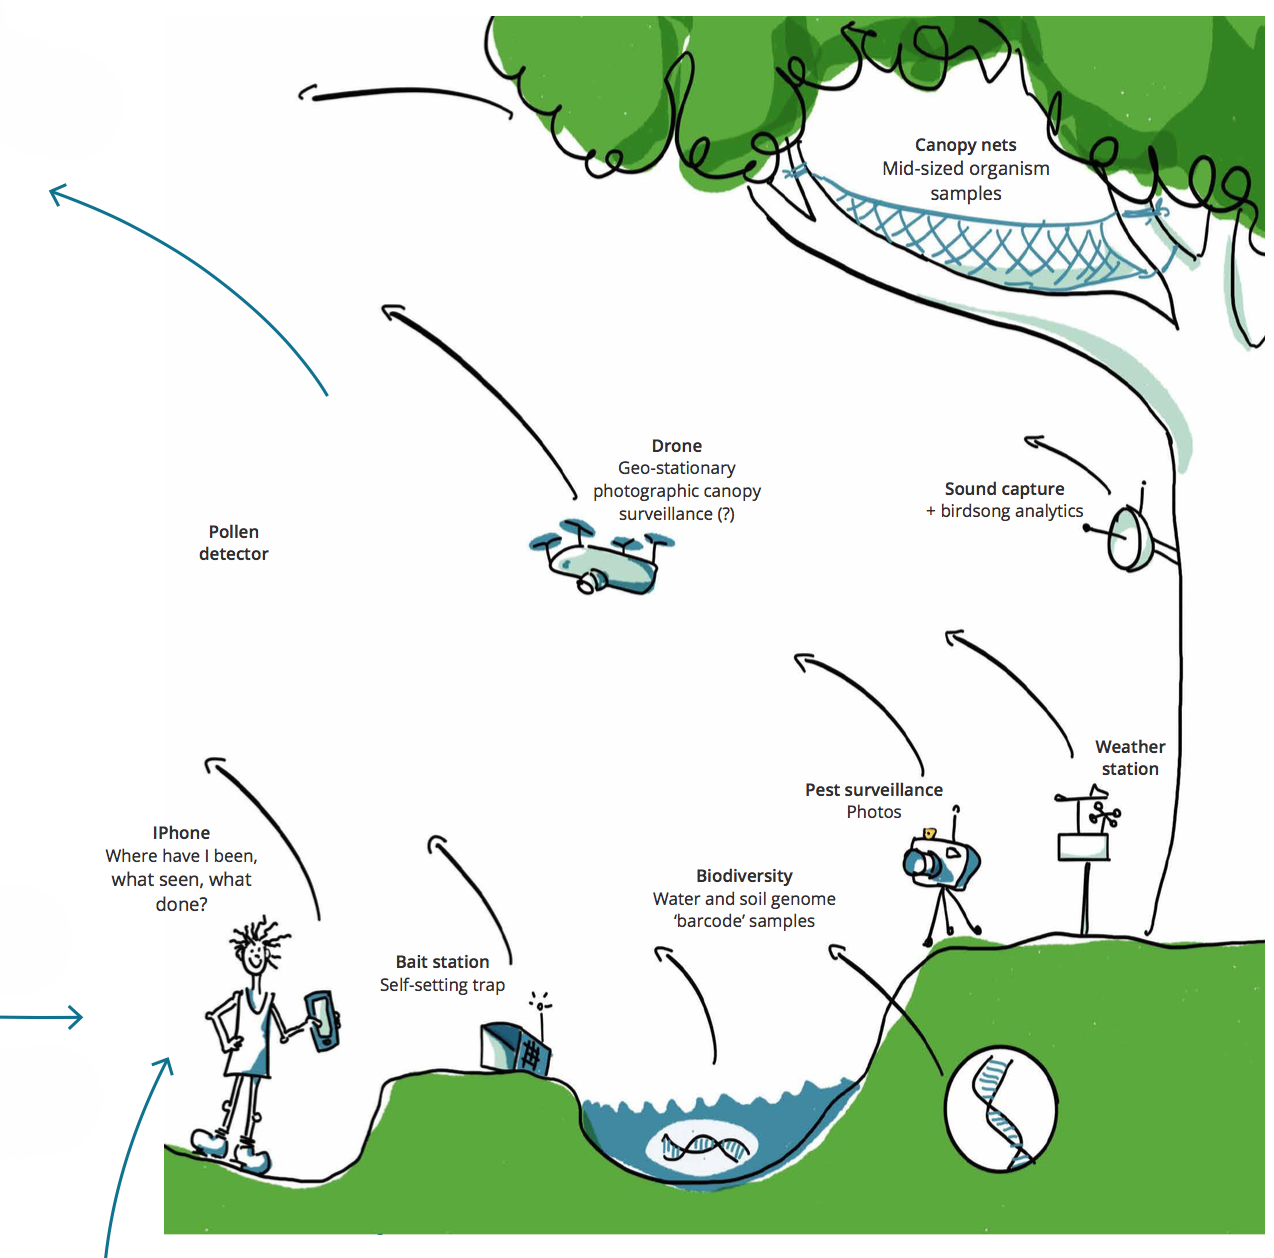
Human ‘sensors’/entrepreneurs/apps
Can connect via a range of apps that can hook into the data commons viasmartphones (field workers) or Internet/tablets for people interested from home/office/community. Tech Entrepreneurs have low cost way to integrate their data or use existing data in innovative ways.